Introducing the Web Console
Sep 1, 2010 13:28 · 1375 words · 7 minute read
David Dahl has been leading the work on Firefox 4’s Web Console feature and has blogged about the work along the way. Over the past month, we’ve landed a whole bunch of improvements to the Web Console in Firefox 4 Beta, and I wanted to give my take on what the Web Console has to offer for web developers.
What is the Web Console?
I first learned to program a computer in BASIC on a TRS-80 Model III. I’m dating myself there, but oh well. Believe it or not, my first programs didn’t always work the way I intended them to and, surprisingly enough, they still don’t. I had two main tools to help me figure out what was going on: a “read eval print loop” (REPL) and “print”. Using the REPL, I could type in simple statements and get immediate results, as a way of testing that how I think an individual operation should work is actually how it does work. Using “print”, I could have my program display certain values along the way so that I could make sure that they met my expectations while the program was running.
Even today, REPL and print continue to be two simple and fundamental tools for learning how a system works and troubleshooting problems. The Web Console gives you these two features for web pages that appear in Firefox.
You can see the Web Console for yourself today by downloading the Firefox 4 beta.
The Log
When you open the Web Console from Firefox’s Tools menu (or using the ctrl-shift-K/cmd-shift-K keyboard shortcut), you’ll see a panel drop down from the top of the content area of the browser. In the current Firefox 4 beta release, the panel is empty when it first opens, but the Firefox 4 final release will collect up logging messages even while the console is closed.
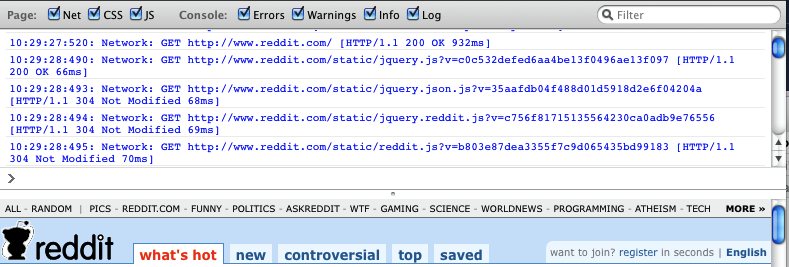
If you open the Web Console and then go to a page, you’ll see a whole bunch of output. Typically, there will be many “Network” requests listed. Sometimes, you’ll see CSS or JavaScript errors displayed. It doesn’t take long for that output to quickly become overwhelming, so we’ve got a simple solution in place to deal with that: filtering. Just above the log output area, there are a number of controls that you can use to pare down the output and see just what you need to see.
- The Net, CSS and JS controls determine which of those types of messages from the browser should appear in the output.
- The Errors, Warnings, Info and Log controls determine which JavaScript-generated messages should appear in the output window (see “The console Object” below
- Finally, there’s a search box to filter the output based on whatever you type there
Using these controls, you should be able to quickly zero in on the messages that will help you debug a problem with your page.
Network Details
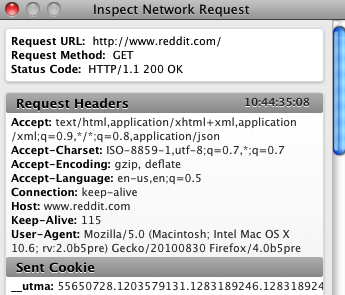
The “Network” requests that appear in the log output show you the URL to which the request was made. But what do you do if your JavaScript made a request to the right URL, but the data that came back isn’t what you expected? If you click on a network log entry in the next beta of Firefox 4, you’ll get a panel with a bunch of details about the request:
With the request and response headers and body and the cookies from the request, you can dive deep into the requests made from your web pages.
The console Object
If you’ve used the excellent Firebug extension (more on Firebug below), you’ve quite possibly encountered its “console” object that is available to JavaScript. console provides a number of useful methods, including a set used for logging information: log, info, warn, error. All four methods work the same way and represent different levels of information logged from log as the lowest level to error as the highest. You can pass in multiple arguments and they will have their string representations glued together for the output. For example, if the variable food is “avocado”, then console.log(“My favorite food is”, food, “and its info is”, anObject) will output “My favorite food is avocado and its info is [object Object]”.
By strategically using the different logging levels, you can make it easy to focus on just the messages that matter to you using the filter controls.
One more note: for Firefox 4, we’re playing it conservatively with the console object. If one is already defined on the page, we won’t override it. As of this writing, there is a bug that prevents the console from working properly on sites that define their own console object, but you can bet we’ll have that bug resolved soon.
The JavaScript REPL
Read Eval Print Loops are fantastic for figuring out how a language or environment works and for testing things quickly. The Web Console features a REPL for JavaScript that gives you access to everything on your page. For every expression you type in, the Web Console will automatically output the result of that expression. That means you can use it as a simple calculator:
For your convenience, the Web Console will automatically try to fill in variable and function names that it knows about:
By using the up and down arrow keys, you can also cycle through the history of commands that you’ve entered.
You can directly access variables that are on the page:
Note that variables that you define in the Web Console are not automatically exposed to the page. If you would like to change a variable on the page, you just need to put “window.” in front of the variable name. For example, if you enter the expression “window.foo = 1”, then the variable “foo” on the page will change to 1.
With access to jQuery and knowledge that Reddit has an element on the page with an id of “header”, it becomes a simple matter to remove the header from the page we’re looking at:
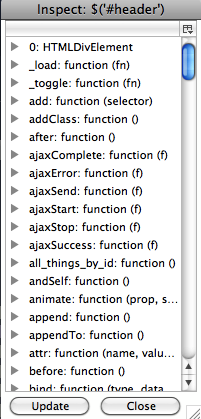
One more note about using the REPL: if your expression returns an object, the console will just show [object Object] currently. However, you can click on [object Object] and see the object inspector:
One nice feature of the object inspector is that it shows you a snapshot in time of the object. You can click the “Update” button if you want to see the current contents of the object.
Firebug
The Firebug add-on has millions of users and has been making web development easier for years. If you’re one of those users, you’re probably wondering why the Web Console exists when Firebug already provides a console and much, much more. Back at the beginning of this post, I talked about how useful a REPL and print are in debugging, experimentation and learning. These things are so fundamental that we wanted them to exist in Firefox with no add-ons required.
Consider this case: you’re a web developer and you have a distant user of your application. They’re running into a problem with your app. They can tell you what’s on the screen, but they have no way of sharing a view of what the application has done to that point. If you have useful logging messages in your app, you can ask the user to copy the console output into an email message and send it to you, all without requiring them to install an add-on.
The Web Console is not a replacement for Firebug, but it will be a great tool to have in a pinch.
What’s Next for the Web Console?
We’re still in the middle of the Firefox 4 beta test cycle, so you can expect to see additional improvements and polish as the beta progresses and we head to the release of Firefox 4. If you’d like to get involved and help make the Firefox developer tools beyond awesome, talk to us! Discussion about the Firefox developer tools comes on the dev-apps-firefox mailing list/newsgroup and in realtime in the #devtools channel on irc.mozilla.org. I’m also happy to receive feedback by email.


